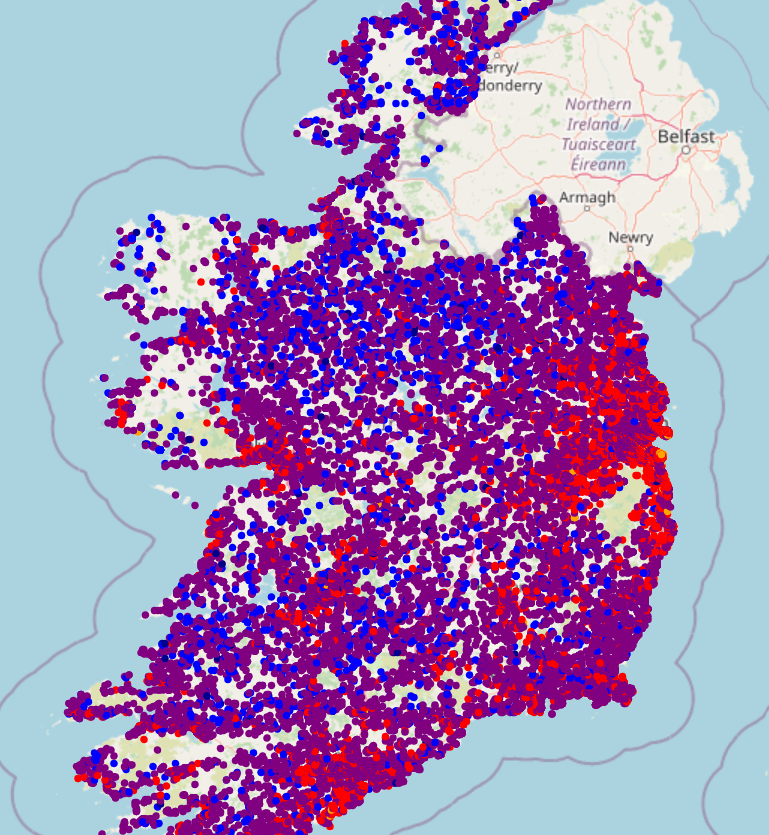
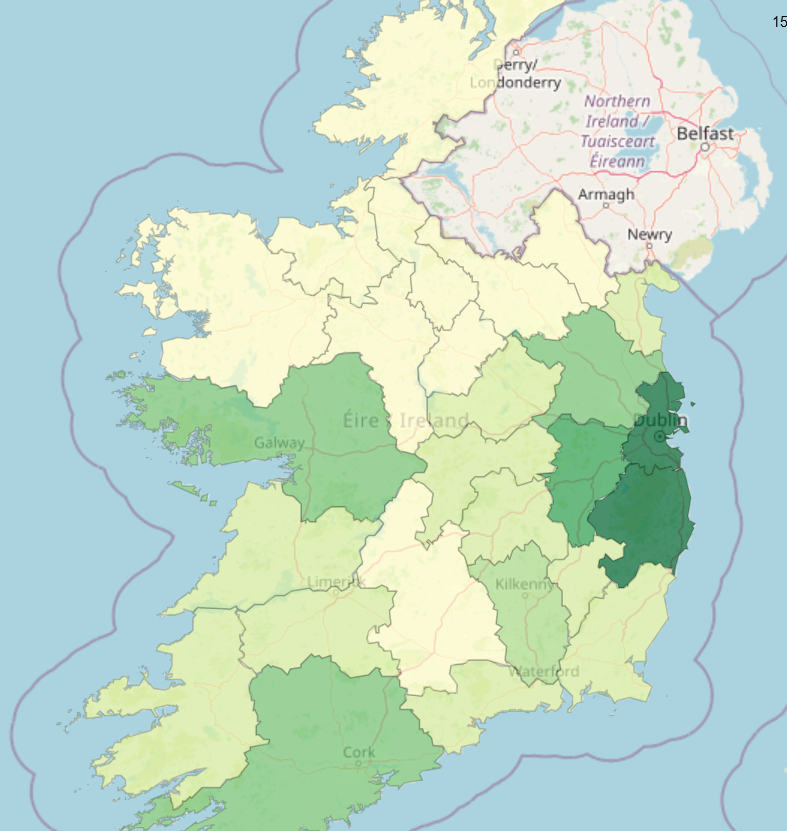
Below you can find the Residential Property Price Register displayed in 2 different ways.
- Each individual sale for 2 years mapped across the country, coloured by price
- Mapped using the median price for each county
Clicking on each of the images below will load the actual interactive map for each.
Because the data is quite large the maps take a while to load.
Be patient!


Great map how do I access the legend and can I use this data in a college project? Im in UCD clearly I would reference your hard work. Cheers
Hi Maria,
The Property Price Register data is freely available at the following address.
https://www.propertypriceregister.ie/Website/NPSRA/pprweb.nsf/page/ppr-home-en
I joined this to eircode data which is available to commercial organisations at a cost here.
https://www.eircode.ie/
If you request the data from them as a student they may help you out.
I am not at liberty to share the data I am afraid.
Good luck with your studies!
Thanks
Richard