I have updated the property data section of my website.
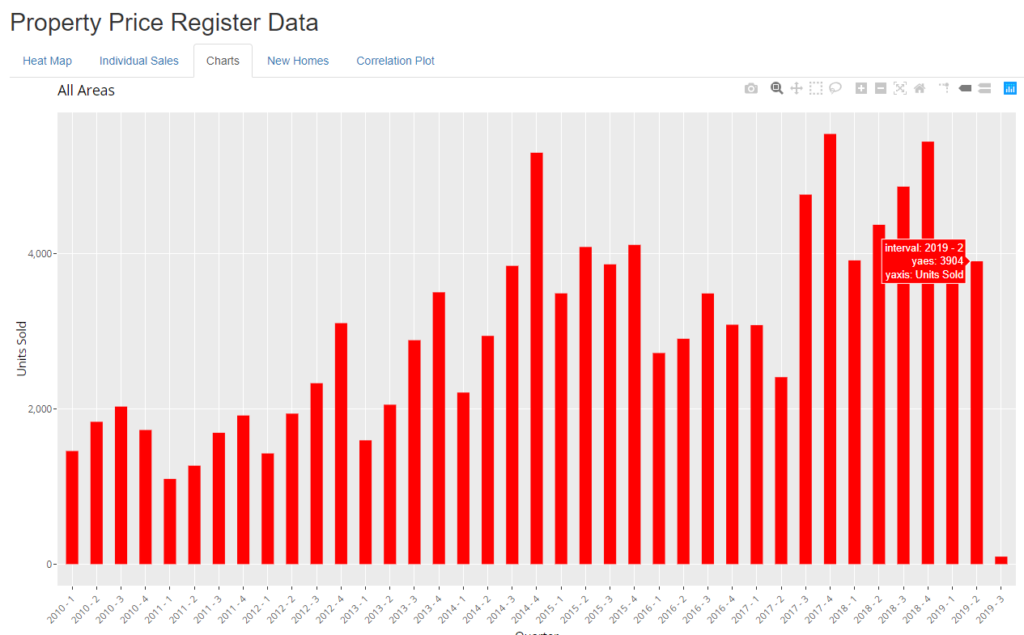
It now has data up until the end of June and a few days of July. It shows the tail off in both property sales and prices for the Dublin region. Using the interactive charts you can explore the property sales by volume and price for the whole of Dublin or individual regions of Dublin. I have added pop-ups to the charts as well so that you can more easily see the actual values represented by each bar in the chart. You can also view the values by year, quarter or month.
The property selling market is seasonal. So sales normally happen in spring and autumn. Of course, calendar quarters overlap the seasons. So spring overlaps Q1 and Q2 while autumn overlaps Q3 and Q4, but form the charts you can see that Q4 is usually the biggest quarter and Q3 is usually the 2nd biggest. So for comparisons one should compare Q2, 2019 with Q2, 2018. You shoudl compare Q3, 2018 with Q3, 2017 etc.
As there is only a very small amount of data for July 2019, any readings for that month or for Q3,2019 are not reliable and should not form the basis of any analysis.
